
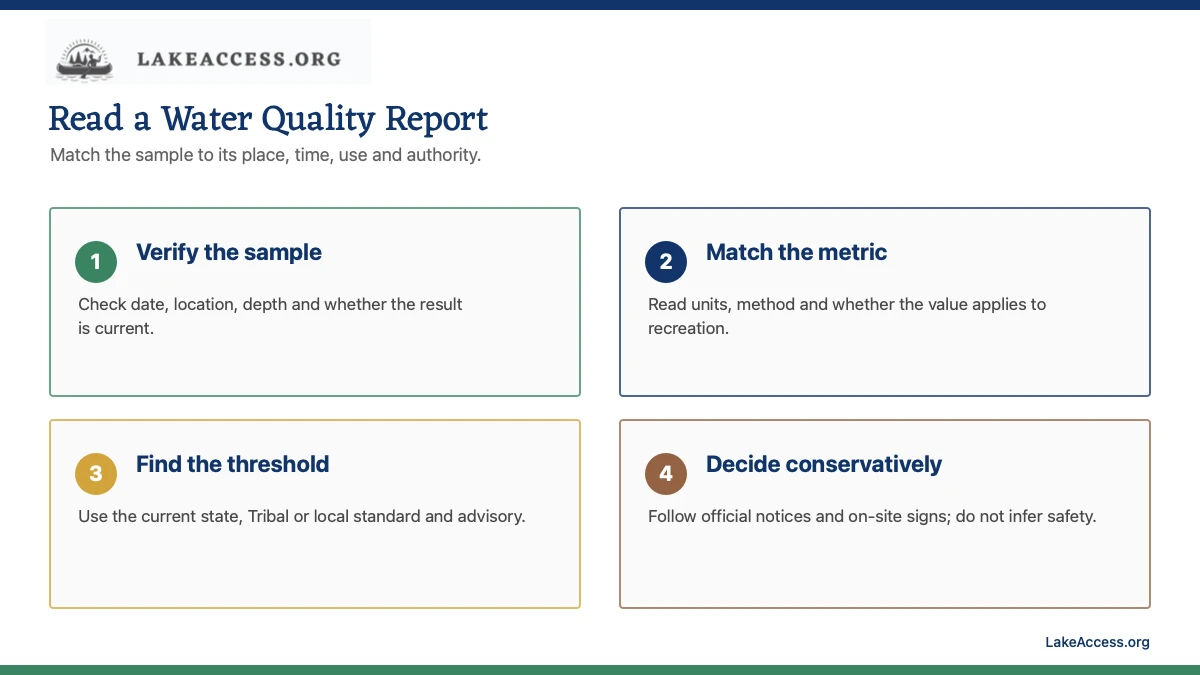
Quick answer: Read a lake water quality report in this order: identify the agency and intended use, confirm the sample location and date, check units and method, compare the result only with the applicable current criterion, and then look for an active advisory. No single number or clear-looking sample proves that an entire lake is safe for every activity.
What to read before making a decision
| Signal | What it can tell you | What it cannot prove | Next check |
|---|---|---|---|
| E. coli or another fecal indicator | A program-specific sign of possible fecal contamination at the sampled place and time | The organism source, every pathogen, or the condition of the whole lake | Current beach notice, sample date, units, method and local recreational criterion |
| Cyanobacteria or cyanotoxin result | Whether a sample contained measured cells, pigments or a named toxin | That every bloom is toxic, or that an unsampled area is clear | Current health notice, toxin method, location and visual conditions |
| Turbidity, clarity or color | Suspended material or a change in light penetration | The cause of cloudiness or whether water is safe to drink or swim | Recent rain, field notes, trend and agency interpretation |
| Nutrients, dissolved oxygen and pH | Conditions related to productivity, habitat and chemical balance | A universal pass/fail result for recreation | Depth profile, season, units, waterbody criteria and trend |
Identify the report purpose before reading the numbers
A beach-monitoring result, a watershed assessment and a drinking-water source report answer different questions. Look for the program name, the designated use and the agency responsible for interpretation. A report may evaluate aquatic life, recreation, nutrients or long-term condition without issuing a trip-day swimming decision. Read the title, scope and definitions before jumping to a colored score or threshold.
Confirm whether the report covers a single sample, a seasonal summary or a multi-year assessment. A summary can reveal patterns but may not describe today. A live advisory can control behavior even when the annual report looks favorable. Conversely, an old exceedance does not prove a current closure. Keep the reporting period attached to every conclusion.
Read bacteria results with their units and sampling design
Fecal indicator bacteria are used by recreational-water programs because they can signal fecal contamination and associated illness risk. The report should identify the organism, units, sample type and applicable criterion. A single-sample value and a geometric mean are not the same calculation. Do not compare numbers across programs until the organism, units and averaging period match.
Find the exact beach or station, collection time and notification status. Rain and runoff can change conditions after sampling, and laboratories need time to produce results. Follow the current advisory or closure issued by the responsible agency; an article cannot convert a laboratory value into a universal permission to swim.
Treat bloom observations and toxin tests as different evidence
A visual bloom report, cyanobacterial cell count, pigment measurement and toxin analysis are different records. Not every visible bloom produces a harmful toxin, and some hazards are not obvious from shore. Read the analyte, method, reporting limit, units and sample location. If the report only documents an observation, do not describe it as a toxin result.
CDC advises staying out of discolored, scummy or foul-smelling water and keeping pets away. That conservative action is useful even when no current sample is available. When a state or local program posts an advisory, use its exact wording and follow its instructions for people, pets, fishing and contact with water.
Use oxygen, pH, nutrients and turbidity as context
Dissolved oxygen can vary by depth and time, especially when a lake stratifies. pH describes acidity or alkalinity at the sampled place. Nutrients such as nitrogen and phosphorus relate to productivity but do not create one universal recreational threshold. Turbidity describes reduced clarity from suspended material, not the identity of every substance in the water.
Look for a depth profile, field notes, calibration or quality flags and a comparison with the waterbody standard. A surface value should not be presented as the bottom condition, and one nutrient sample cannot establish the cause of a bloom. Use these parameters together with the program interpretation, not as isolated safety labels.
Read qualifiers, detection limits and missing values
Reports often attach letters, symbols or notes to a result. These can identify an estimated value, a result below the laboratory reporting limit, a rejected sample, a duplicate, a holding-time problem or another quality-control condition. Open the legend and preserve the qualifier when recording the number. A blank cell, zero and not detected are not automatically the same result.
Check whether the laboratory method and reporting limit are appropriate for the program question. Do not turn a value below detection into proof that the substance is absent, and do not use a rejected or incomplete sample as current reassurance. When the report lacks a clear legend, ask the issuing program how to interpret it.
Compare like with like when looking for a trend
A useful trend comparison keeps the station, depth, season, units, method and sampling design as consistent as possible. Moving a station, changing a laboratory method or comparing spring turnover with late-summer stratification can create an apparent change that needs context. Read the report methods and footnotes before declaring that a lake improved or declined.
Use multiple observations and the agency assessment rather than choosing the highest or lowest result. A long-term trend can inform planning and stewardship, but it still does not replace the latest beach notice or field condition. Keep the long-term question separate from the trip-day decision.
Start with the agency that owns the decision
A search result, weather app, marina post or crowd-sourced map can help locate a data source, but it does not issue the rule for a lake. Identify the agency that operates the reservoir, samples the beach, manages the park or publishes the health notice. The responsible organization may be a state environmental or health department, a Tribe, county health office, city beach manager, federal reservoir operator or utility. Save the exact page and the agency name with the trip plan.
Jurisdiction matters because two access points on the same water can use different monitoring programs or notices. A federal gauge may describe elevation while a county notice controls swimming at one beach. A park closure can remain in effect even when a regional dashboard looks normal. When sources disagree, follow the most current instruction from the agency responsible for the exact activity and location, and contact that agency rather than averaging the answers.
Read the timestamp before the value
Live data is only live relative to its collection and publication time. Find the observation time, time zone, update frequency and any provisional-data label. A dashboard opened today can display a sample collected several days earlier. Automated stations can also stop reporting, retain a last value or publish a quality-control flag. Record the timestamp in the same note as the value so it cannot be separated from its age.
Think about what could have changed since the measurement. Rain, wind, heat, inflow, dam operations, a sewage release, a bloom, heavy use or a sensor problem can alter conditions. A trend can be more useful than one point, but a trend still does not override an active advisory or on-site sign. Refresh the official page shortly before departure and again when practical on the trip day.
Match the station to the exact place
Similar lake names, multiple basins and distant stations are common sources of error. Confirm the waterbody, state, county, station identifier and map position. On a large lake, a main-channel buoy may not represent a shallow cove, tributary beach or protected marina. A downstream river gauge may respond differently from the reservoir pool. Save a second source or station when the first one is not clearly connected to the destination.
Also read the sampling depth and method. A surface temperature, a probe one meter below a buoy and a deep profile are different observations. A bacteria sample at a designated beach answers a narrower question than a watershed nutrient assessment. A gauge elevation describes a reference surface, not the depth at every dock or ramp. Use the measurement only for the question its location and method can support.
Separate observation, model, forecast and notice
An observation records what a sensor or sample measured. A model estimates conditions between observations. A forecast projects future conditions. An advisory or closure tells the public what action the responsible agency recommends or requires. Each can be useful, but they are not interchangeable. Label them in your notes and avoid presenting a modeled map as a field measurement or a measurement as a safety clearance.
Provisional readings may change after review, and a forecast includes uncertainty. A notice can also remain active while resampling is underway. Look for quality flags, explanatory notes and the latest agency update. If the source does not explain whether a value is observed, modeled or forecast, do not build a high-risk decision around it.
Use thresholds only for the activity and jurisdiction named
Water-quality criteria, recreational advisories, reservoir operating bands and local access rules are written for particular uses. A value acceptable for one purpose may not answer whether swimming, drinking, fishing, paddling or launching is appropriate. Units and averaging periods matter too. Do not compare a single sample with a multi-sample criterion, or copy a threshold from another state, Tribe or program without confirming that it applies.
The safest workflow is to let the issuing agency interpret its own program. Read the current notice, definitions and required action. If the threshold or status is unclear, treat the uncertainty as unresolved. This guide teaches how to locate and read public data; it does not certify a lake, diagnose an exposure or replace health, emergency, navigation or engineering advice.
Check conditions at the access point
Online data should lead to an on-site verification, not replace it. Read posted signs, look for barriers or staff instructions and confirm the exact ramp, beach, trail or dock remains open. Leave when an official closure, severe weather, unsafe water appearance, damaged infrastructure or another hazard conflicts with the plan. Do not enter restricted areas to inspect a sensor or obtain a closer photograph.
Keep people and pets away from discolored, scummy or foul-smelling water, and follow local health guidance. Never taste water or handle a suspicious bloom to test it. A clear appearance is not proof that water is safe, and an unusual color is not a laboratory result. Use visual conditions as a reason to pause and seek current official information.
Save an offline trip record
Before leaving reliable service, save the source URL, agency phone number, station or beach name, timestamp, screenshot or downloaded report, and the decision it supports. Include a backup destination. A small record makes it easier to notice when two sources refer to different places or times, and it helps explain why a trip plan changed.
Do not rely on a screenshot alone when the status may change. Refresh the source when connectivity returns and keep emergency alerts enabled. For repeated visits, compare records over time while preserving units and datum. The goal is a repeatable verification habit, not a permanent claim that a lake always behaves the same way.
Trip-day checklist
- Save the agency, program, report date and intended use.
- Match the exact station, beach, depth and sample time.
- Keep organism, analyte, units, method and averaging period together.
- Open the current advisory or closure page separately.
- Follow on-site signs and stop when conditions look or smell abnormal.
Related LakeAccess guides
- How to know if a lake is safe to swim in
- Blue-green algae in lakes
- What lake water color can mean
- How to check harmful algal bloom alerts
Sources
Monitoring methods, notices and operating data can change. These official or high-trust sources were checked July 18, 2026; open them again for the trip date.
- EPA factsheets on water quality parameters (checked July 18, 2026)
- USGS National Water Quality Network (checked July 18, 2026)
- USGS Water Data for the Nation (checked July 18, 2026)
- Water Quality Portal (checked July 18, 2026)
- EPA recreational water quality criteria and methods (checked July 18, 2026)
- CDC guidance for oceans, lakes and rivers (checked July 18, 2026)
- EPA harmful algal blooms in water bodies (checked July 18, 2026)